![Cloudsmith]()
![Cloudsmith]()
![Cloudsmith]()
![Cloudsmith]()
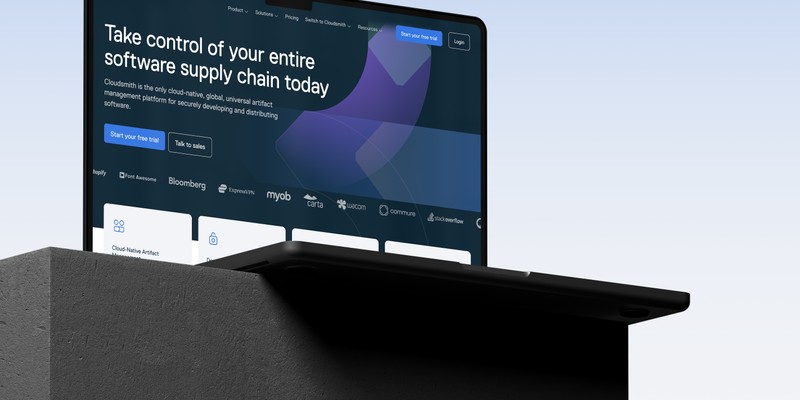
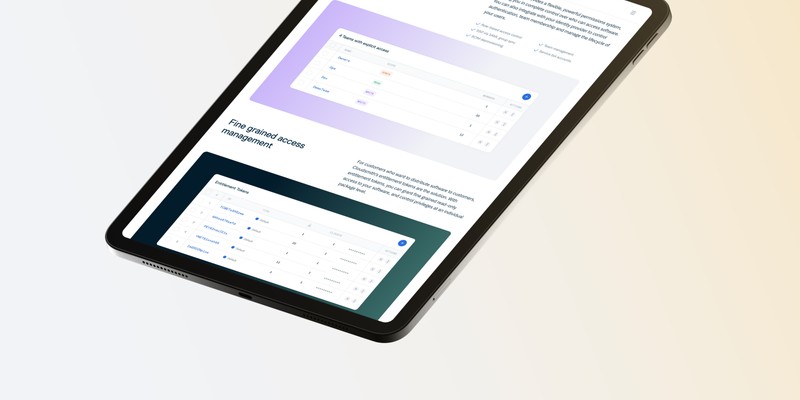
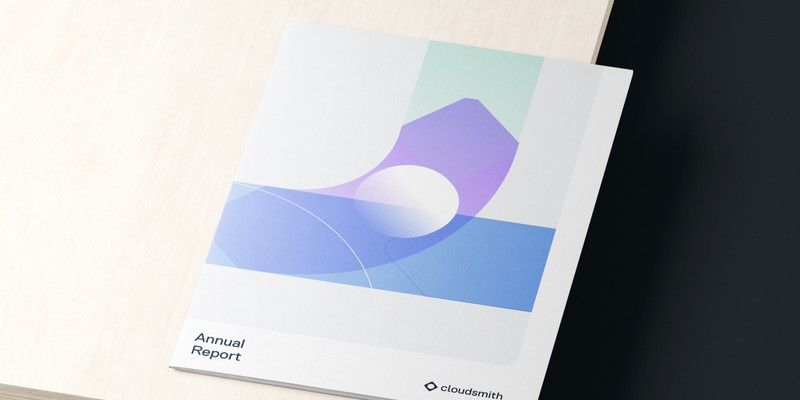
Cloudsmith
Redefining how a fast-growing SaaS communicates value
2023![Chief]()
![Chief]()
![Chief]()
![Chief]()
Chief
Elevating marketing operations to keep up with rapid growth
2022![Google]()
![Google]()
Google
Exploring the power of AI for everyday objects
2022![Digital Witness Lab]()
![Digital Witness Lab]()
![Digital Witness Lab]()
![Digital Witness Lab]()
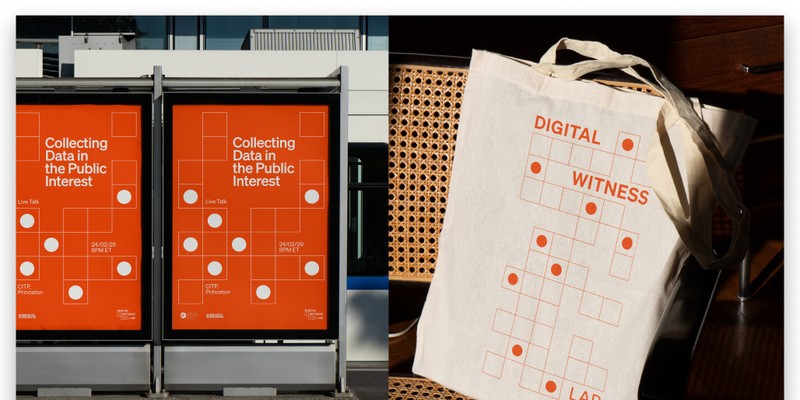
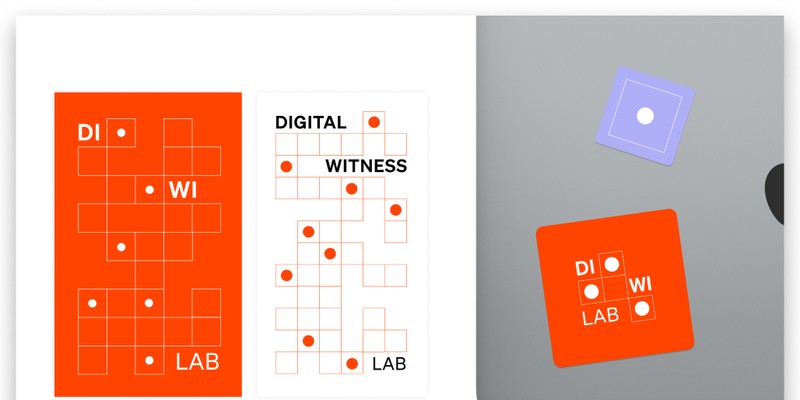
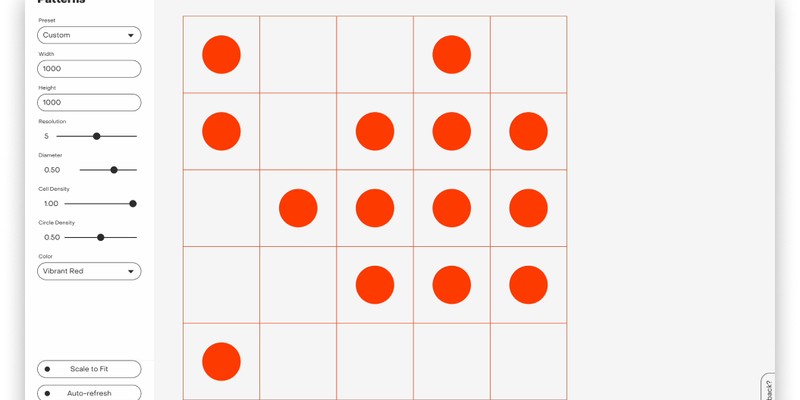
DigitalWitnessLab
Designing for DiWi, Data, and Democracy.
2024![O’Reilly]()
![O’Reilly]()
![O’Reilly]()
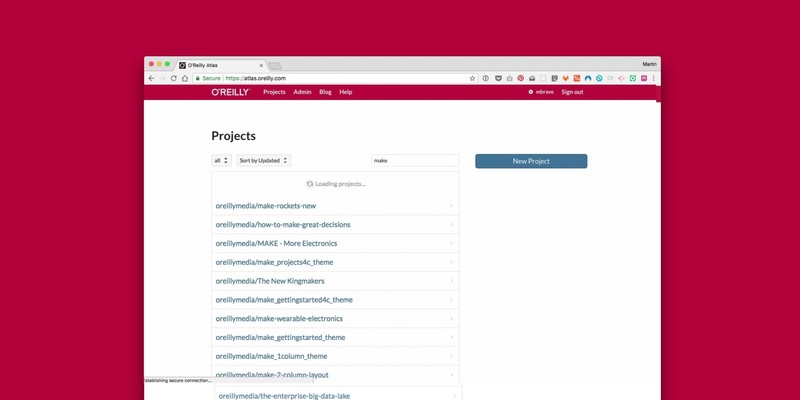
O’Reilly
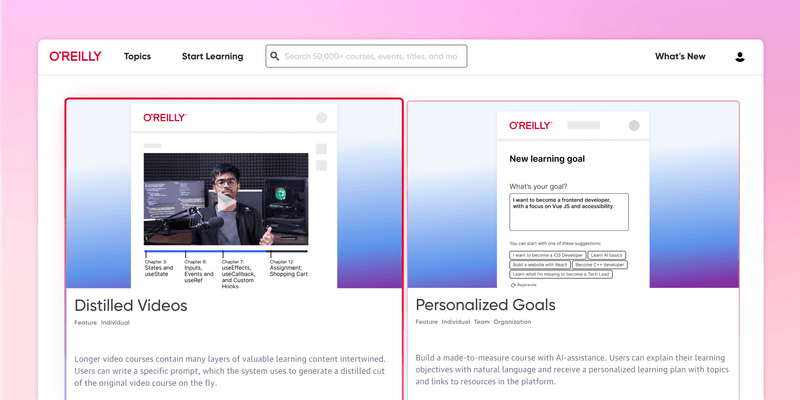
Reimagining learning interfaces for an online education platform
2024![O’Reilly]()
![O’Reilly]()
![O’Reilly]()
O’Reilly
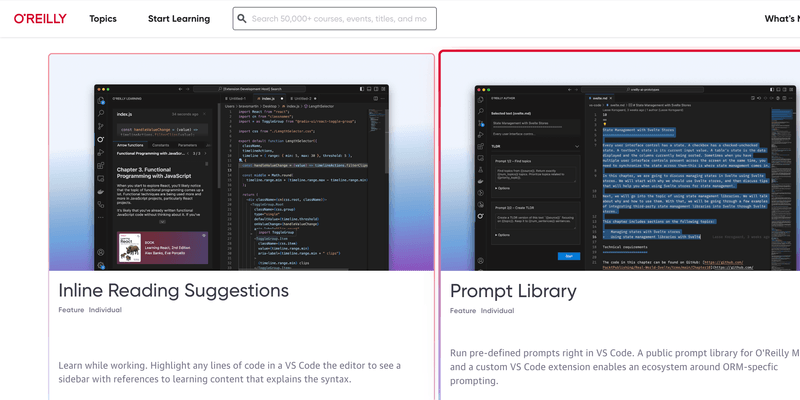
Augmenting tech literacy through custom VSCode extensions.
2024![O’Reilly]()
![O’Reilly]()
![O’Reilly]()
O’Reilly
Transforming educational content into personalized audio-based formats.
2024![Processing Foundation]()
![Processing Foundation]()
![Processing Foundation]()
![Processing Foundation]()
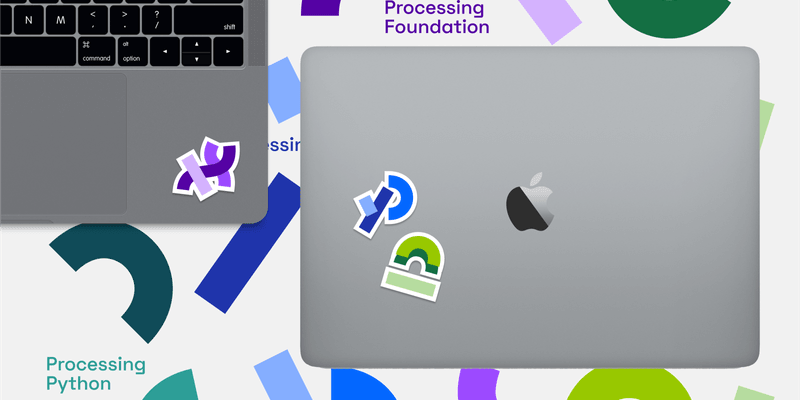
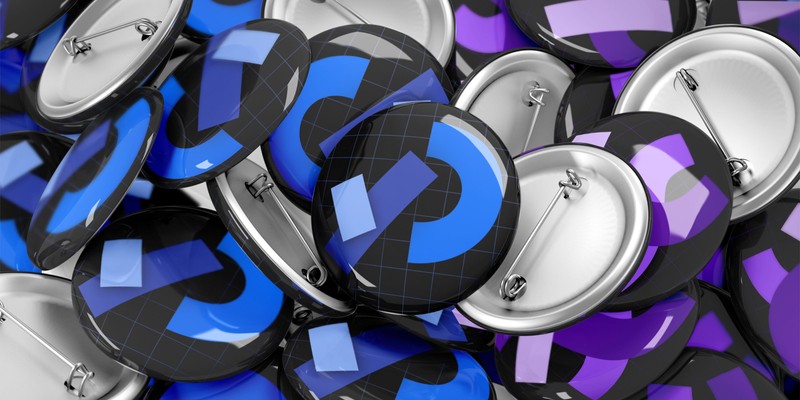
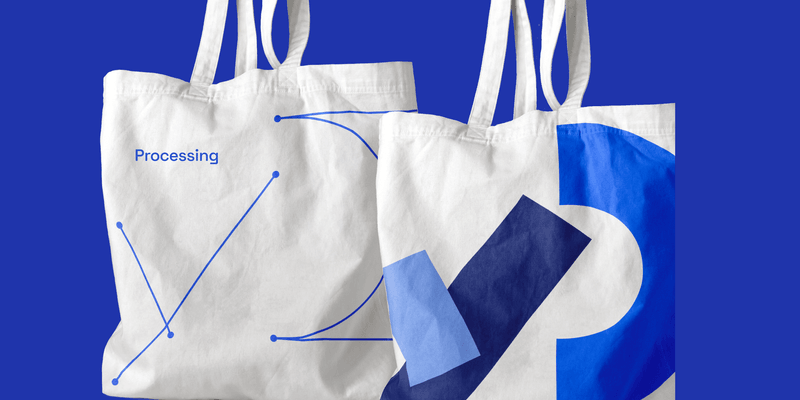
ProcessingFoundation
Designing for an organization, a software, and a community
2021![Fintual]()
![Fintual]()
![Fintual]()
![Fintual]()
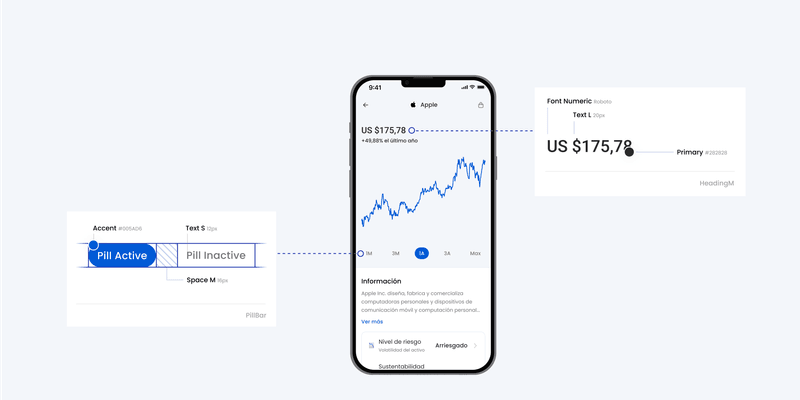
Fintual
Connecting product and brand with a new design system
2022![AIxDesign]()
![AIxDesign]()
![AIxDesign]()
![AIxDesign]()
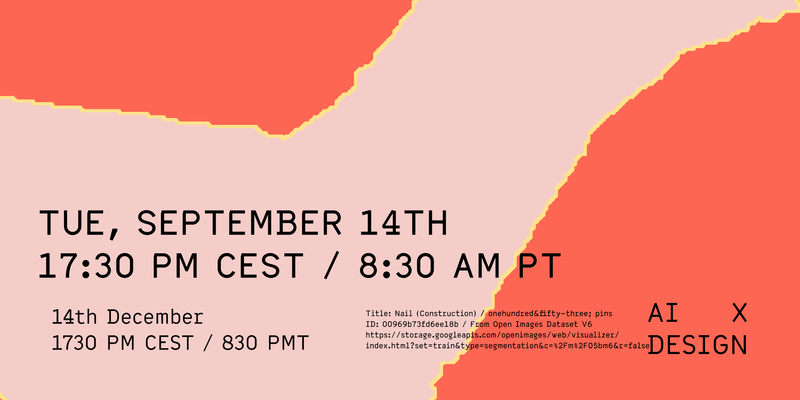
AIxDesign
Designing a visual system for AI powered by AI
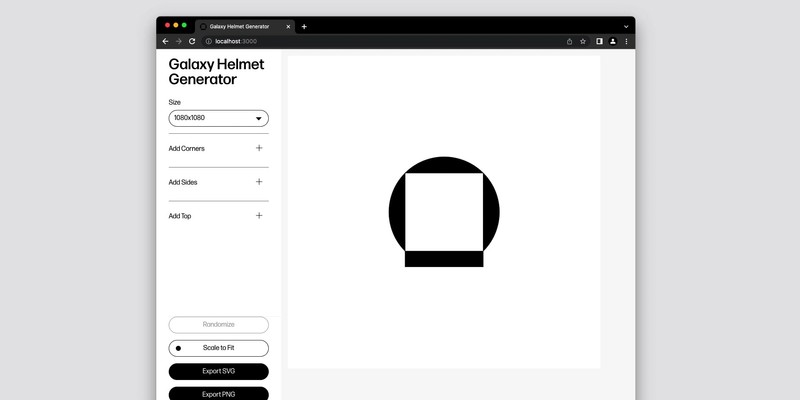
2022![Galaxy]()
![Galaxy]()
![Galaxy]()
![Galaxy]()
Galaxy
A custom tool for workflows based around a dynamic visual identity
2022![Noa Noa]()
![Noa Noa]()
![Noa Noa]()
![Noa Noa]()
NoaNoa
A digital system as high energy as the night club
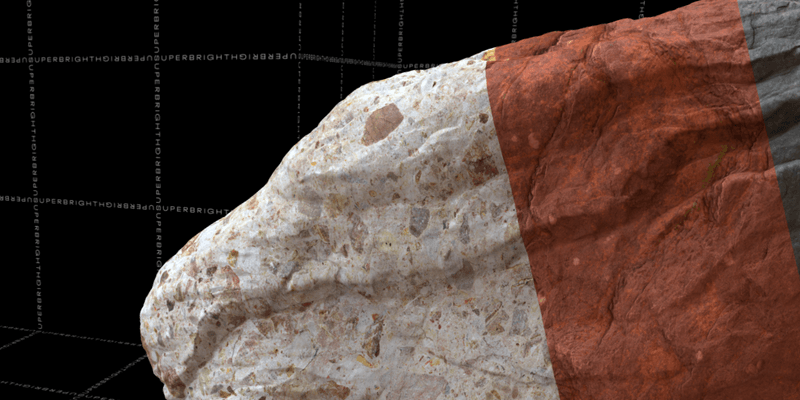
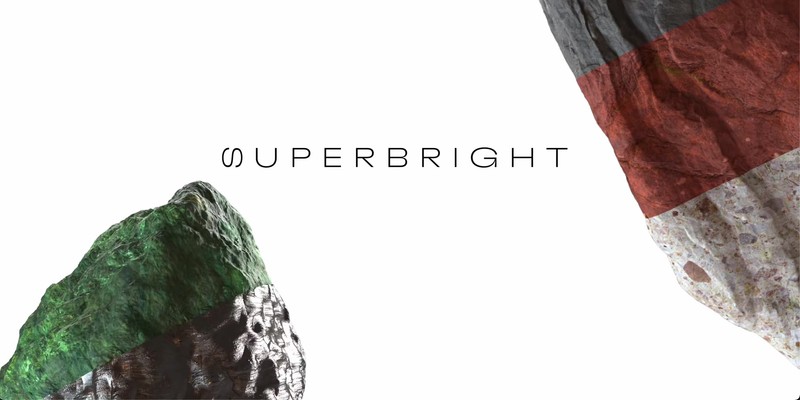
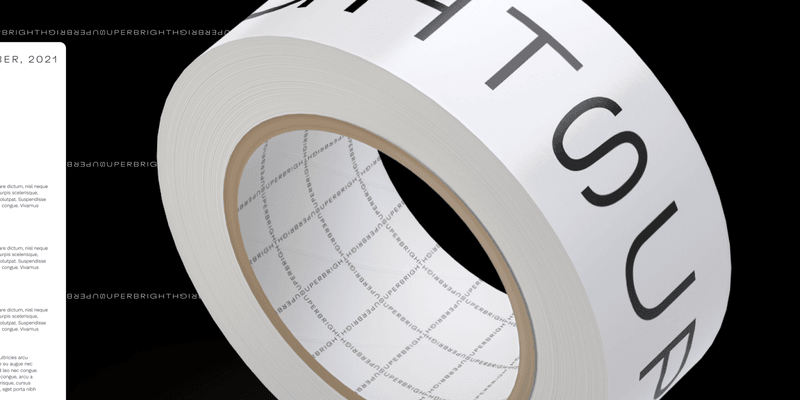
2019![Superbright]()
![Superbright]()
![Superbright]()
![Superbright]()
Superbright
Communicating immersive capabilities with a material identity
2021![Cash App]()
![Cash App]()
CashApp
New opportunities for a targeted user segment
2023![Unit]()
![Unit]()
![Unit]()
![Unit]()
Unit
A visual system to stand out in the landscape of service design
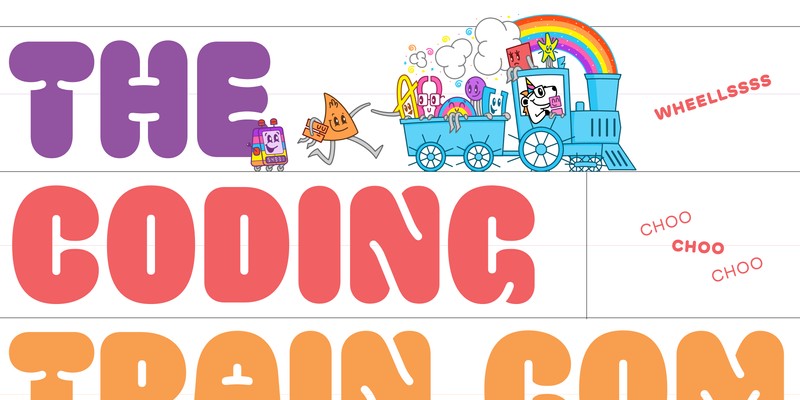
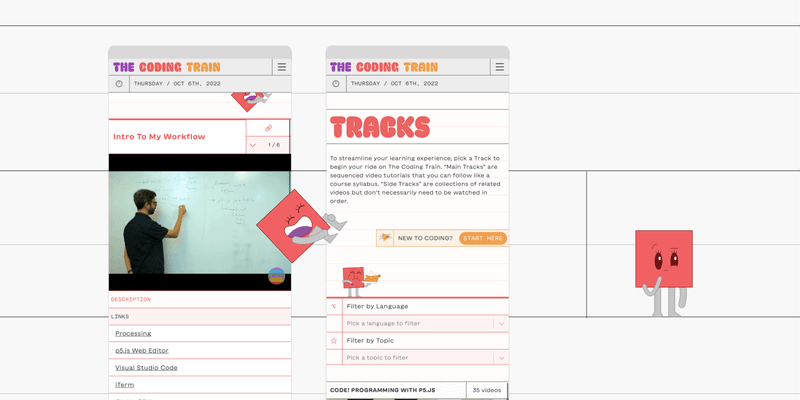
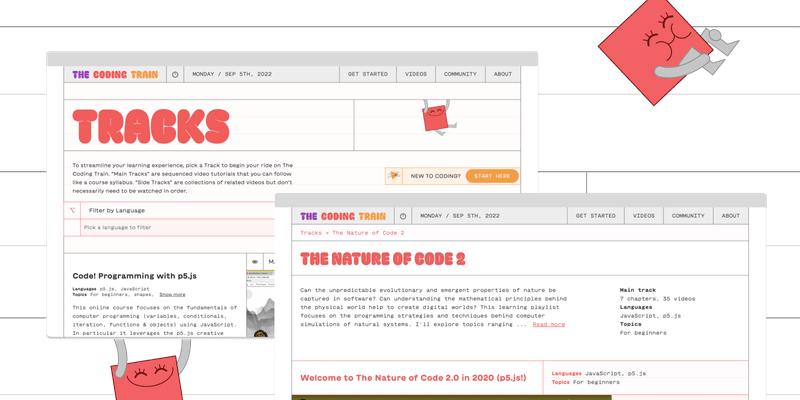
2021![The Coding train]()
![The Coding train]()
![The Coding train]()
TheCodingtrain
A vibrant new hub for a tight-knit coding community
2022![1976]()
![1976]()
![1976]()
![1976]()
![1976]()
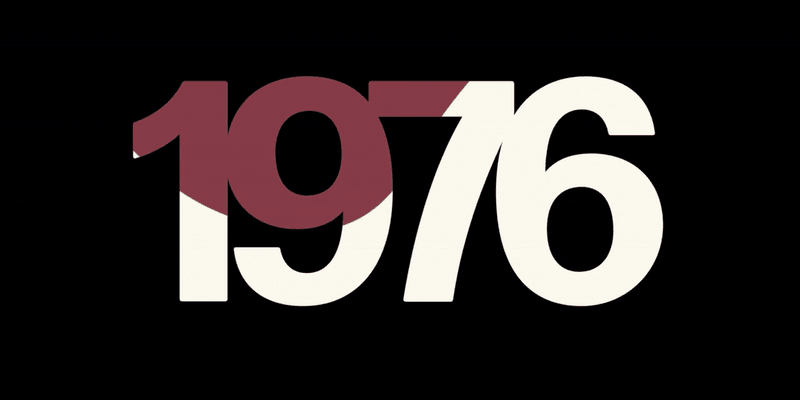
1976
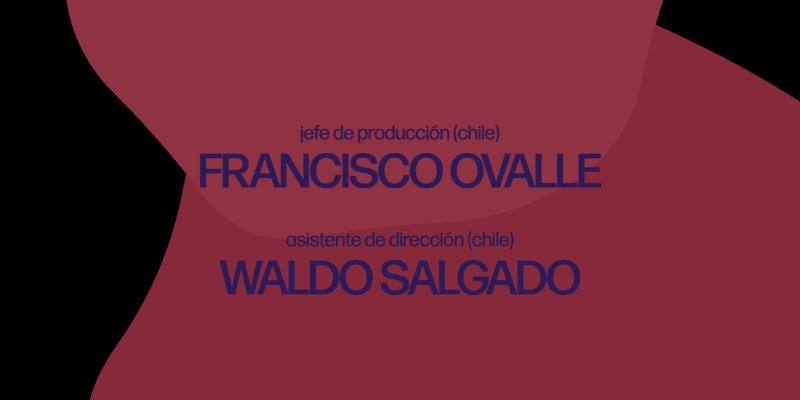
Automating the process of creating title and credit sequences
2022![Google]()
![Google]()
Google
Rethinking existing technologies for new applications
2022![Round]()
![Round]()
![Round]()
![Round]()
Round
Strategic communication through web-based storytelling
2021![Tectonic resonances]()
![Tectonic resonances]()
![Tectonic resonances]()
![Tectonic resonances]()
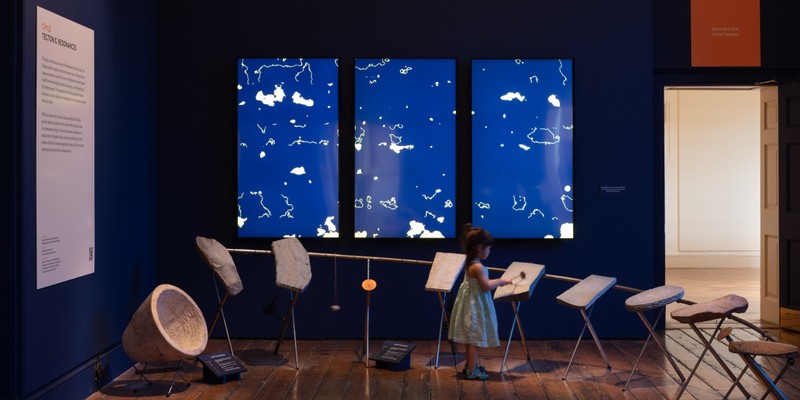
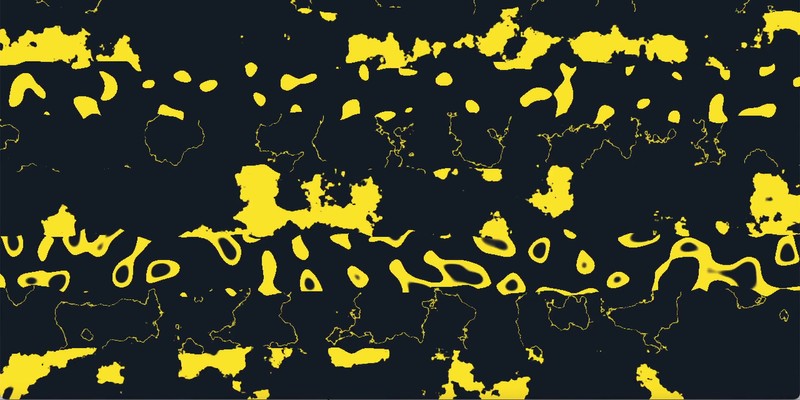
Tectonicresonances
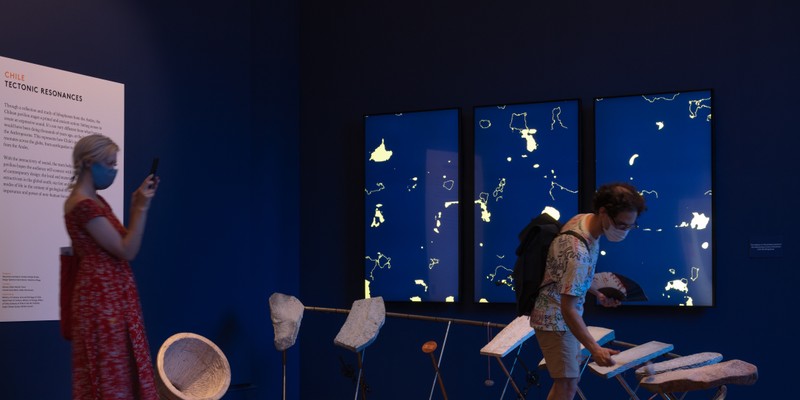
Visualizing the sound of ancient instruments
2021![TIAA]()
![TIAA]()
TIAA
Transforming financial behaviors through digital experiences
2021![Purísima]()
![Purísima]()
![Purísima]()
Purísima
A dynamic stripe of text for a new venue and cultural center
2021![TIAA]()
![TIAA]()
TIAA
A central engaging resource for all things internal
2020![Maletek]()
![Maletek]()
![Maletek]()
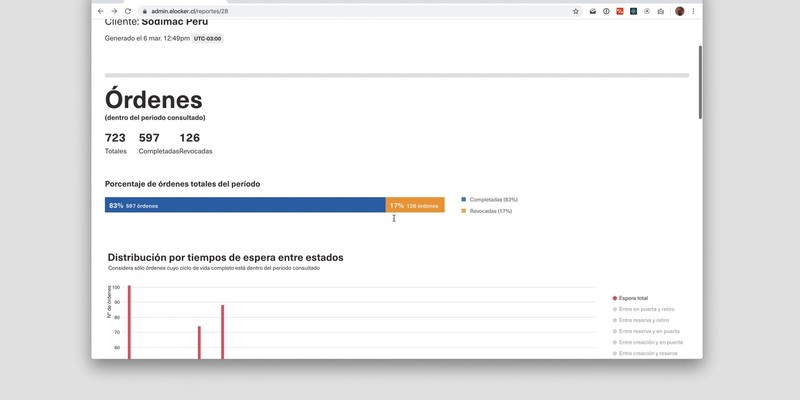
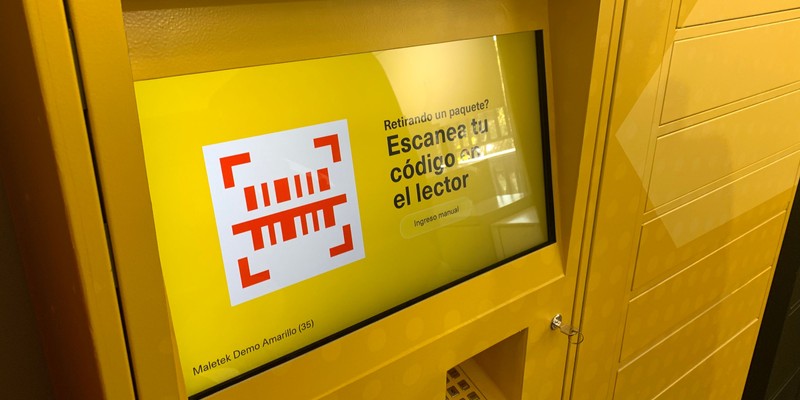
Maletek
A smart locker system ahead of its time
2020![EuroMOMO]()
![EuroMOMO]()
![EuroMOMO]()
![EuroMOMO]()
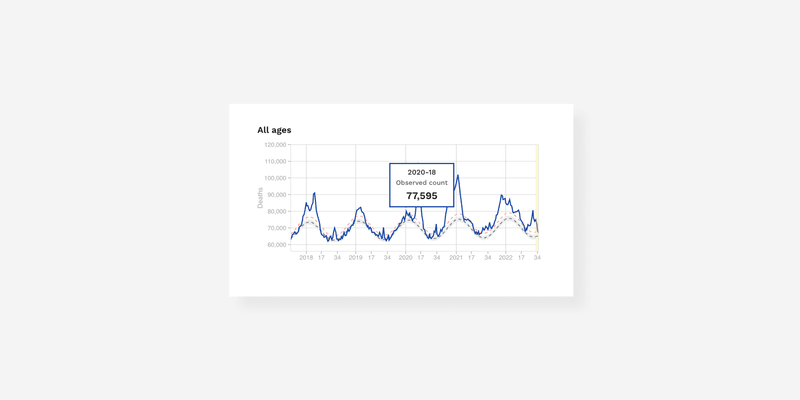
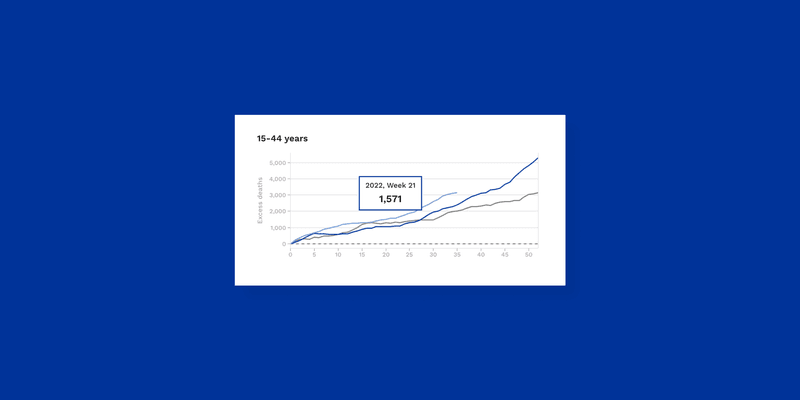
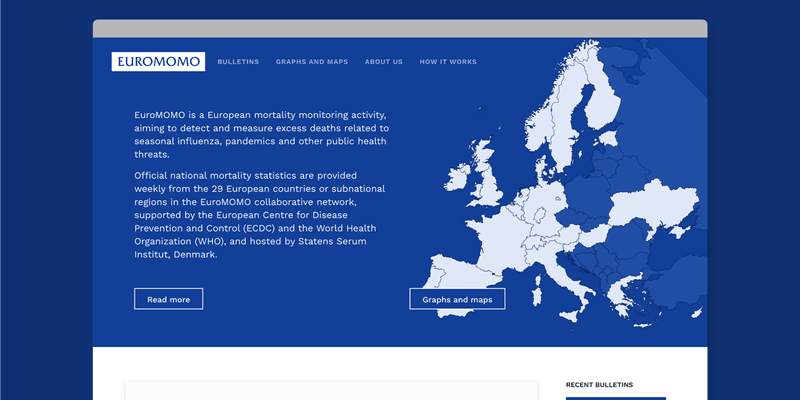
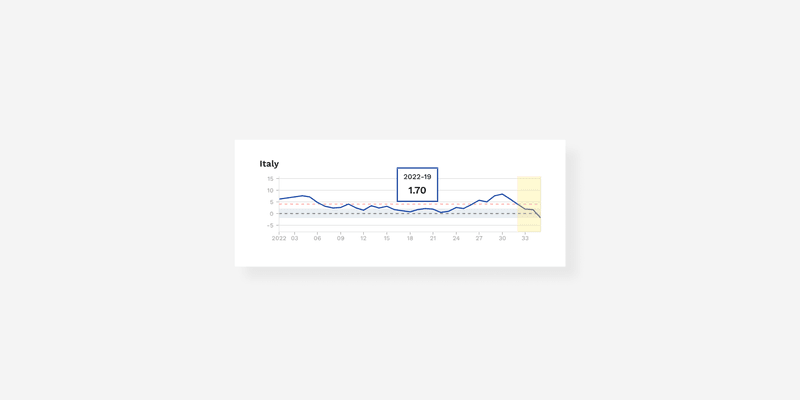
EuroMOMO
Visualizing mortality data at the height of a pandemic
2020![O’Reilly Media]()
![O’Reilly Media]()
![O’Reilly Media]()
![O’Reilly Media]()
O’ReillyMedia
An enduring partnership to reinvent a learning company
2019![Google]()
![Google]()
Google
Exploring possible applications of a new technology
2019![MIT Libraries]()
![MIT Libraries]()
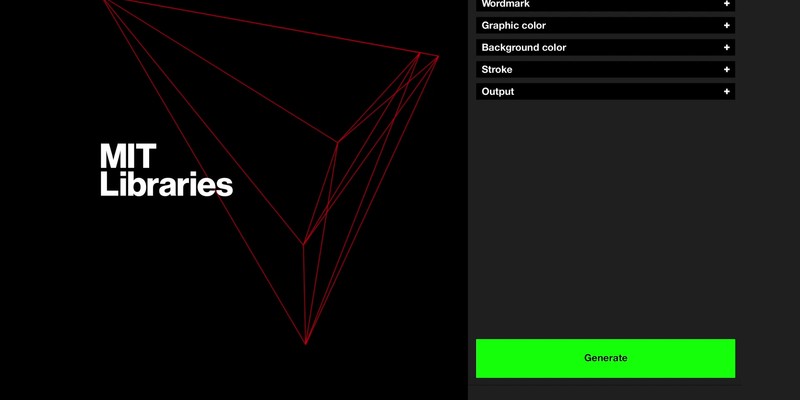
MITLibraries
A custom tool for a dynamic brand identity
2018![CCC]()
![CCC]()
![CCC]()
![CCC]()
CCC
Streamlining communications with a dynamic identity system
2018
D
E
S
I
G
N
S
Y
S
T
E
M
S
I
N
T
E
R
N
A
T
I
O
N
A
L
Our Work
We help clients (re)imagine, design, and build the right systems to drive lasting growth.
